
Technical Analysis on FxPro Platforms
Technical Analysis on FxPro Platforms

Technical analysis is one of the most widely used methods in forex trading. It involves analyzing past market data, primarily price and volume, to forecast future price movements. FxPro offers various tools and platforms that allow traders to implement technical analysis strategies, helping them make informed decisions.
This article provides a detailed overview of technical analysis for traders using FxPro. We will explore the key components of technical analysis, how to use them effectively, and how to apply this knowledge to develop successful trading strategies in 2025.
What is Technical Analysis?
Technical analysis is the study of historical price movements and patterns to predict future price behavior. Unlike fundamental analysis, which focuses on economic indicators, technical analysis looks purely at price data and market trends. The core principle is that all information is reflected in the price, and past market behavior tends to repeat itself.
Key Concepts in Technical Analysis
- Price Charts: Price charts are the foundation of technical analysis. They allow traders to visualize price movements over time, helping identify trends and potential reversals.
- Trends: A trend is the general direction in which the price of an asset is moving. There are three main types of trends:
- Uptrend: When prices are consistently rising.
- Downtrend: When prices are consistently falling.
- Sideways/Range-bound: When prices move within a specific range, neither rising nor falling significantly.
- Support and Resistance Levels: Support is a price level where a downtrend is expected to pause due to increased buying interest. Resistance is a price level where an uptrend may pause or reverse, typically due to increased selling pressure.
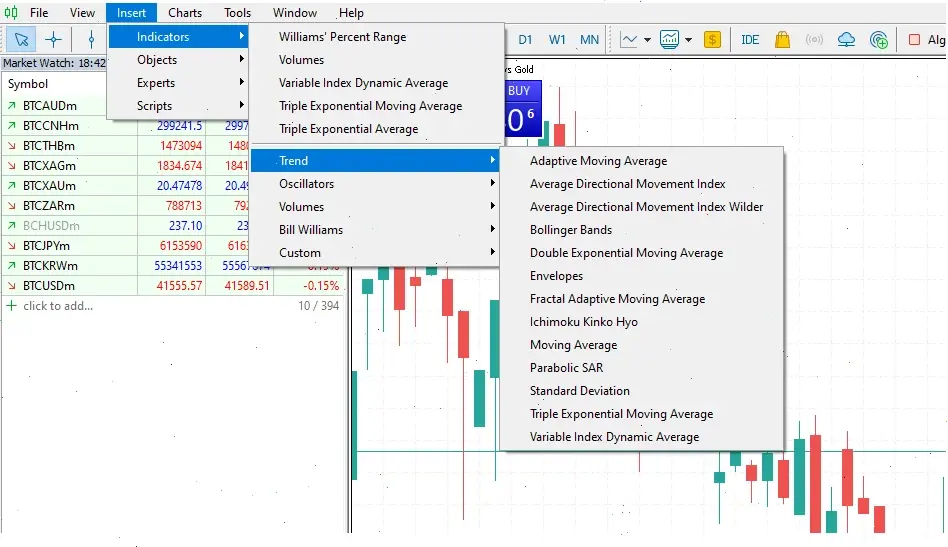
- Indicators and Oscillators: These are mathematical calculations based on price, volume, or open interest data, designed to assist in technical analysis. Some popular examples include:
- Moving Averages (MA): Helps smooth out past price data to create a trend-following indicator.
- Relative Strength Index (RSI): Measures the speed and change of price movements to determine overbought or oversold conditions.
- Bollinger Bands: Uses standard deviations to measure price volatility and identify potential breakout points.
Key Tools for Technical Analysis on FxPro
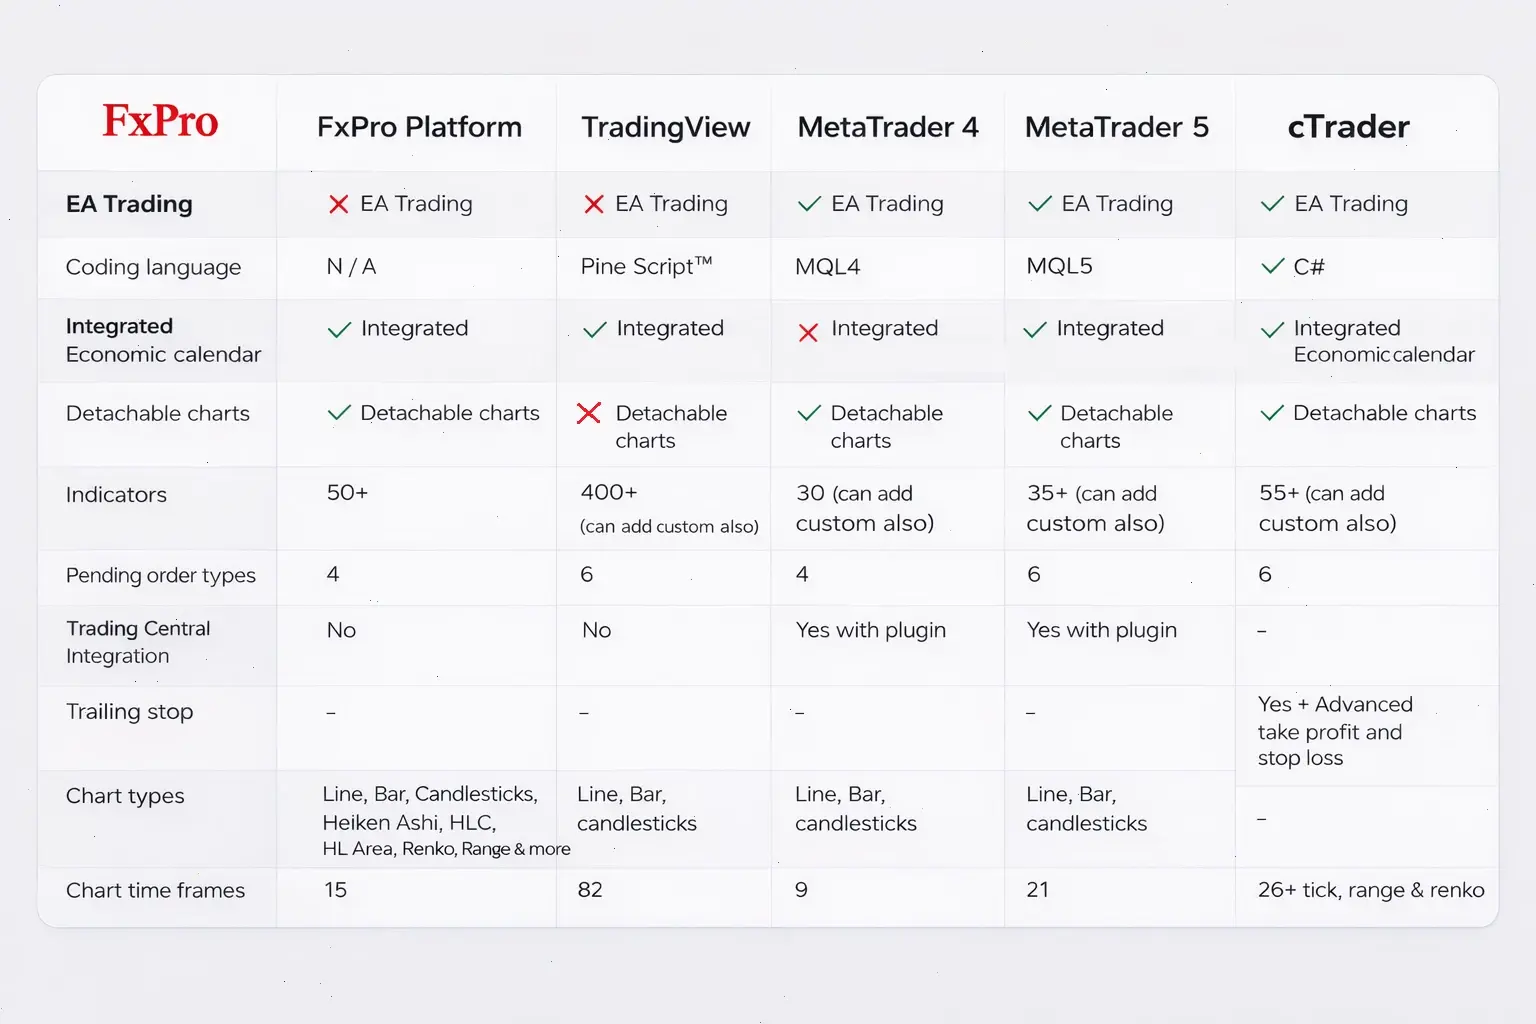
FxPro offers a variety of tools and platforms designed to help traders apply technical analysis to their trading strategies. The most popular platforms used by FxPro traders are MetaTrader 4 (MT4), MetaTrader 5 (MT5), and cTrader.
- MetaTrader 4 (MT4)
MT4 is one of the most widely used platforms for forex trading, known for its reliability and simplicity. FxPro offers MT4 as part of its platform offerings, providing traders with powerful charting tools, technical indicators, and the ability to automate trading strategies through Expert Advisors (EAs).
Key Features of MT4:
- Wide range of technical indicators, including moving averages, RSI, MACD, and more.
- Customizable charts for in-depth analysis.
- Capability to set up alerts for market conditions.
- Automated trading through Expert Advisors (EAs).
- MetaTrader 5 (MT5)
MetaTrader 5 is the next generation of MT4, offering additional features and enhanced capabilities. It supports more timeframes, technical indicators, and additional chart types. MT5 is ideal for traders who require more advanced tools and multi-asset trading capabilities.
Key Features of MT5:
- 21 timeframes and more advanced chart types.
- Integrated economic calendar for keeping up with market-moving events.
- Advanced technical analysis tools, including more indicators and tools.
- Supports multi-asset trading (including stocks, commodities, and futures).
- cTrader
cTrader is known for its intuitive interface and advanced charting features. It offers more advanced capabilities compared to MT4, including level II pricing, a better user interface, and greater flexibility for technical analysis.
Key Features of cTrader:
- Level II pricing for better market visibility.
- Advanced charting with a wide variety of technical indicators.
- cAlgo for algorithmic trading, allowing traders to automate their strategies.
- User-friendly and highly customizable interface.
How to Use Technical Analysis Effectively on FxPro
- Identify Market Trends
The first step in any technical analysis strategy is to identify the current market trend. Is the market in an uptrend, downtrend, or range-bound? By using trend lines and moving averages, traders can clearly see whether the market is trending and in which direction.
Example:
- Uptrend: If the price is consistently making higher highs and higher lows, the market is in an uptrend. Traders should look for buying opportunities.
- Downtrend: If the price is making lower lows and lower highs, the market is in a downtrend. Traders should look for selling opportunities.
- Use Support and Resistance Levels
Support and resistance are key components of technical analysis. These levels help traders identify price points where the market may reverse or pause. Traders should use support and resistance levels to set their entry and exit points.
Example:
- Support Level: If the price repeatedly bounces back up after touching a certain level, this is a support level. Traders may enter long positions near these levels.
- Resistance Level: If the price repeatedly fails to break through a certain level, this is a resistance level. Traders may consider shorting the market near these levels.
- Apply Technical Indicators
Using technical indicators can help traders identify potential buying or selling opportunities. The most commonly used indicators include moving averages, RSI, and MACD. For example, a trader might use the Relative Strength Index (RSI) to determine if an asset is overbought or oversold.
Example:
- Overbought Condition: If the RSI is above 70, the asset may be overbought, and the price could potentially reverse downwards.
- Oversold Condition: If the RSI is below 30, the asset may be oversold, and the price could potentially reverse upwards.
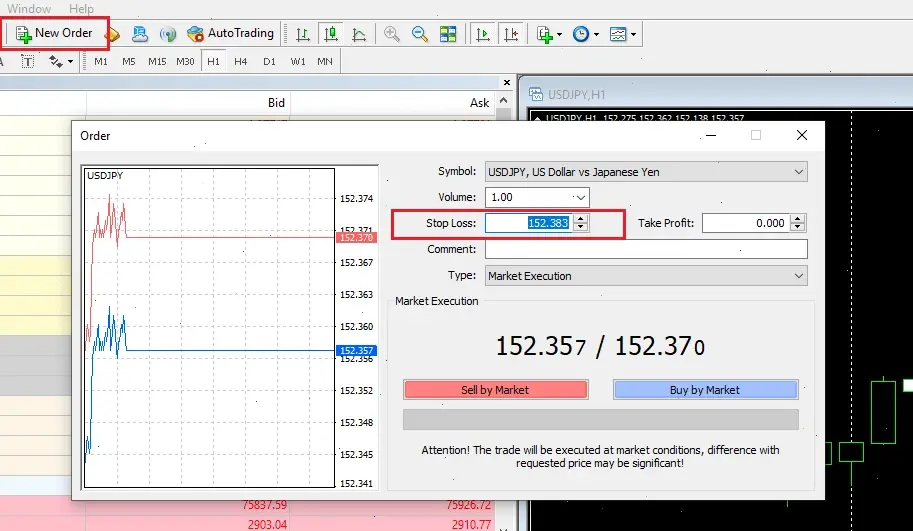
- Set Stop-Loss and Take-Profit Levels
Risk management is a critical part of any trading strategy. Traders should always set stop-loss and take-profit levels when placing trades. These levels help limit potential losses and lock in profits when the market moves in their favor.
Example:
- Stop-Loss: A trader might set a stop-loss order just below the support level to minimize risk if the market reverses.
- Take-Profit: A trader might set a take-profit order at the next resistance level to secure profits before the price faces potential resistance.
Key Challenges in Technical Analysis
While technical analysis is a powerful tool, it does have its limitations. The most significant challenges include:
- False Signals: Technical analysis can generate false signals, especially in volatile markets. Traders must be cautious and not rely solely on technical indicators.
- Over-reliance on Historical Data: Past price movements do not guarantee future performance. Market conditions can change rapidly due to external factors like news events and geopolitical developments.
- Complexity: Some technical indicators and chart patterns can be complex and difficult for beginners to interpret. It's important to practice and gain experience before applying advanced strategies.
Conclusion
Technical analysis is an essential skill for forex traders. By using platforms like FxPro’s MT4, MT5, and cTrader, traders have access to powerful tools and resources to analyze the market and make informed decisions. By understanding trends, applying support and resistance levels, using indicators, and managing risk, traders can improve their chances of success in the forex market.
FAQ
- What is the best trading platform for technical analysis?
- FxPro offers several platforms, including MT4, MT5, and cTrader, all of which are excellent for technical analysis. The choice depends on the trader's needs and experience level.
- How can I learn technical analysis?
- Learning technical analysis involves studying chart patterns, indicators, and trading strategies. Practicing with demo accounts and backtesting strategies can help develop proficiency.
- What is the best indicator for forex trading?
- There is no single "best" indicator. Commonly used indicators include the Moving Average, Relative Strength Index (RSI), and MACD. The choice of indicator depends on the trader's strategy.
- Is technical analysis reliable for predicting market movements?
- Technical analysis provides valuable insights, but it is not foolproof. It should be used alongside other forms of analysis and risk management strategies to improve decision-making.
- Can technical analysis be automated?
- Yes, platforms like MetaTrader and cTrader support automated trading through Expert Advisors (EAs) and cAlgo, allowing traders to automate their technical analysis-based strategies.