Best Forex Indicators
Best Forex Indicators

Introduction
In the world of forex trading, understanding and applying the right indicators can significantly enhance your trading strategy. However, theory alone is not enough—practical experience is key. This article takes you beyond theoretical explanations and provides real-world examples using the best forex indicators, such as Moving Averages, RSI, MACD, Bollinger Bands, and Fibonacci Retracement. These examples will demonstrate how to apply them effectively on the FxPro platform for making more informed trading decisions.
Using Moving Averages on FxPro: A Step-by-Step Example
Scenario: Identifying a Trend with Moving Averages
Let’s assume you are trading the EUR/USD pair on FxPro. You decide to use Exponential Moving Averages (EMA) to identify the direction of the market.
Steps:
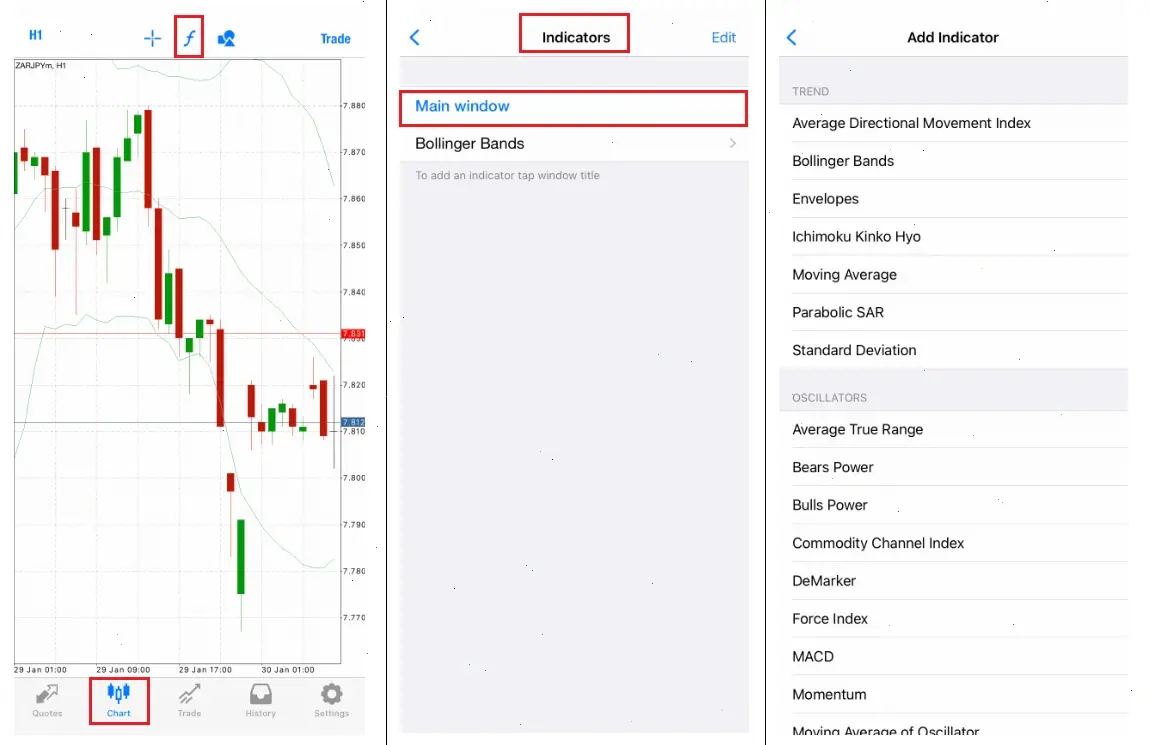
- Set Up the Chart: Open the EUR/USD chart on the MetaTrader 4 (MT4) or MetaTrader 5 (MT5) platform, available on FxPro. Set the time frame to 1-hour.
- Apply the Indicators: On the chart, apply two Exponential Moving Averages (EMA):
- A short-term EMA with a period of 9 (for quicker market reactions).
- A long-term EMA with a period of 21 (for smoother, more stable trend tracking).
- Interpret the Crossovers:
- If the 9-period EMA crosses above the 21-period EMA, this is a bullish signal indicating that the price is likely to rise.
- If the 9-period EMA crosses below the 21-period EMA, this is a bearish signal, indicating the price is likely to fall.
Example Trade:
- On November 1, 2024, the 9-period EMA crossed above the 21-period EMA at 1.0875, signaling a potential buy.
- You enter a buy order at 1.0875 with a take profit set at 1.0925 and a stop loss at 1.0850.
- The price moves upward, and at 1.0925, you close the position, securing a 50-pip profit.
Application in FxPro:
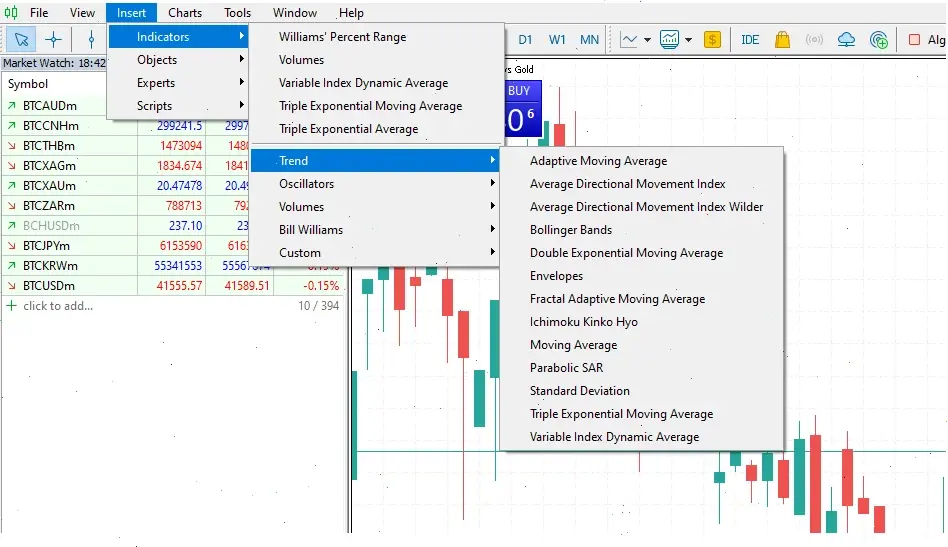
On FxPro’s MT4/MT5 platform, you can apply these moving averages through the Navigator window. Once added, monitor the crossovers for entry and exit signals.
Using RSI on FxPro: A Step-by-Step Example
Scenario: Identifying Overbought and Oversold Conditions with RSI
The Relative Strength Index (RSI) is a momentum oscillator that measures the speed and change of price movements. Let’s apply RSI to detect overbought and oversold conditions on EUR/USD on FxPro.
Steps:
- Set Up the Chart: Open the EUR/USD chart on FxPro’s MetaTrader platform and select the 4-hour timeframe.
- Apply RSI: Add the RSI indicator with a period of 14.
- Identify Overbought/Oversold Levels:
- Overbought: When RSI exceeds 70, the market might be overbought, indicating a potential sell.
- Oversold: When RSI falls below 30, the market might be oversold, signaling a potential buy.
Example Trade:
- On November 22, 2024, the RSI on the 4-hour chart reached 72, signaling overbought conditions. This suggested a potential reversal or sell opportunity.
- You place a sell order at 1.0930.
- The price drops to 1.0890, and you close the position for a 40-pip profit.
Application in FxPro:
The RSI is available in both MT4 and MT5 platforms. By setting up the indicator, you can quickly spot overbought and oversold conditions, which are helpful for reversal strategies.
Using MACD on FxPro: A Step-by-Step Example
Scenario: Identifying Trend Strength and Reversals with MACD
The Moving Average Convergence Divergence (MACD) is a trend-following momentum indicator. Let’s use it to identify the strength of the current trend and potential reversals on the GBP/USD pair.
Steps:
- Set Up the Chart: Open the GBP/USD chart on FxPro’s MetaTrader platform, selecting the 4-hour timeframe.
- Apply MACD: Use the standard MACD settings: 12, 26, 9 (Fast EMA, Slow EMA, Signal line).
- Interpret MACD Signals:
- MACD Line Crossing Signal Line: A crossover of the MACD line above the signal line is a bullish signal, while a crossover below the signal line is a bearish signal.
- MACD Histogram: The histogram shows the distance between the MACD and the signal line. A larger histogram suggests a stronger trend.
Example Trade:
- On November 5, 2024, the MACD line crossed above the signal line at 1.2500, signaling a buy opportunity.
- You enter a buy order at 1.2500 and set the take profit at 1.2550 and stop loss at 1.2470.
- The price rises to 1.2550, and you close the trade, securing a 50-pip profit.
Application in FxPro:
In MT4/MT5, the MACD is available from the Navigator section. You can easily monitor the MACD line and histogram to make quick trading decisions.
Using Bollinger Bands on FxPro: A Step-by-Step Example
Scenario: Identifying Breakouts and Reversals with Bollinger Bands
Bollinger Bands consist of a middle band (SMA) and two outer bands that adjust based on market volatility. Let’s use this indicator on USD/JPY to identify breakout opportunities.
Steps:
- Set Up the Chart: Open the USD/JPY chart on FxPro’s MT4/MT5, selecting the 1-hour timeframe.
- Apply Bollinger Bands: Set the period to 20 and the deviation to 2 (the standard settings).
- Interpret Breakouts:
- When the price breaks above the upper band, it may signal a bullish breakout.
- When the price breaks below the lower band, it may signal a bearish breakout.
- Narrowing bands often indicate low volatility and the potential for a breakout.
Example Trade:
- On November 10, 2024, the price of USD/JPY broke above the upper Bollinger Band at 134.50, indicating a potential bullish breakout.
- You enter a buy order at 134.50 and set the take profit at 135.00 and the stop loss at 134.20.
- The price moves up to 135.00, and you close the position, securing a 50-pip profit.
Application in FxPro:
In MT4/MT5, Bollinger Bands can be applied easily from the Navigator section. The bands adjust dynamically, giving you a clear view of volatility and potential price breakouts.
Conclusion
Using forex indicators effectively requires understanding their individual strengths and limitations. Moving averages are useful for trend-following strategies, while the RSI and MACD are better for identifying overbought/oversold conditions and potential reversals. Bollinger Bands are ideal for breakout strategies, and Fibonacci retracement levels can guide you in pinpointing key support and resistance areas. Combining these indicators in your trading strategy can lead to better-informed decisions and more successful trades.
By applying these indicators on the FxPro platform, you can leverage advanced charting tools and real-time data to enhance your trading performance and adapt to various market conditions.
FAQ
- How do I use moving averages on FxPro?
- To use moving averages on FxPro, open the chart for your chosen currency pair, then apply the moving average indicator from the Navigator section in MT4/MT5. You can select between SMA or EMA and adjust the period based on your trading strategy.
- What is the best time to use the RSI?
- The RSI is best used during periods of consolidation or when the market is overbought or oversold. Look for overbought conditions when the RSI is above 70 and oversold conditions when it is below 30.
- How do I interpret the MACD on FxPro?
- On FxPro's platform, you can use the MACD to spot trend reversals and momentum. When the MACD line crosses above the signal line, it's a buy signal, and when it crosses below, it's a sell signal.
- What do Bollinger Bands indicate?
- Bollinger Bands indicate periods of high and low volatility. A breakout above or below the bands may signal a new market trend, while narrowing bands often indicate a potential breakout after a period of low volatility.
- Can I use multiple indicators at once on FxPro?
- Yes, you can combine multiple indicators on FxPro's MT4/MT5 platforms to confirm signals and enhance your strategy. Many traders use a combination of trend-following and momentum indicators for better decision-making.