
Key Takeaways
- Unlock a full suite of technical indicators tailored for the dynamic South African day trading environment.
- Implement advanced strategies using powerful moving averages, momentum, volume, and volatility indicators.
- Experience seamless integration across MetaTrader 4, MetaTrader 5, and cTrader with customizable alerts and templates.
Table of Contents
- The Foundation: Finding the Best Indicators for Day Trading Analysis at FxPro
- Harnessing Moving Averages for Strategic Trades
- Pinpointing Entries with Momentum Indicators
- Gaining an Edge with Volume Analysis
- Mastering Volatility with Bollinger Bands
- Identifying Key Levels with Support and Resistance
- Projecting Market Moves with Fibonacci Tools
- Reading Market Psychology with Candlestick Patterns
- Your Trading Ecosystem: Platform Integration and Alerts
The Foundation: Finding the Best Indicators for Day Trading Analysis at FxPro
Our platform provides comprehensive technical analysis tools specifically designed for South African day traders. We integrate advanced charting capabilities with real-time market data to support informed trading decisions. The FxPro trading environment includes over 50 technical indicators, customizable chart layouts, and automated analysis features.
Day trading demands precise timing and accurate market interpretation. Our technical analysis suite combines traditional indicators with modern algorithmic tools. We offer MetaTrader 4, MetaTrader 5, and cTrader platforms, each featuring distinct indicator libraries and analytical capabilities.
The foundation of successful day trading lies in understanding price action patterns, volume analysis, and momentum indicators. Our platform automatically calculates indicator values and displays visual signals directly on price charts. We provide real-time updates with millisecond precision to ensure accurate market timing.
| Indicator Category | Available Tools | Platform Support | Update Frequency |
|---|---|---|---|
| Trend Indicators | Moving Averages, MACD, ADX | MT4, MT5, cTrader | Real-time |
| Momentum Indicators | RSI, Stochastic, Williams %R | MT4, MT5, cTrader | Real-time |
| Volume Indicators | OBV, Volume Profile, A/D Line | MT5, cTrader | Real-time |
| Volatility Indicators | Bollinger Bands, ATR, VIX | MT4, MT5, cTrader | Real-time |
Harnessing Moving Averages for Strategic Trades
Moving averages form the cornerstone of our day trading indicator system. We provide simple moving averages (SMA), exponential moving averages (EMA), and weighted moving averages (WMA) with customizable periods. Our platform calculates these indicators automatically and displays crossover signals for entry and exit points.
Exponential Moving Average Configuration
The EMA responds faster to recent price changes compared to simple moving averages. We recommend using 9-period and 21-period EMAs for day trading setups. Our system highlights bullish crossovers when the shorter EMA crosses above the longer EMA, indicating potential buy opportunities.
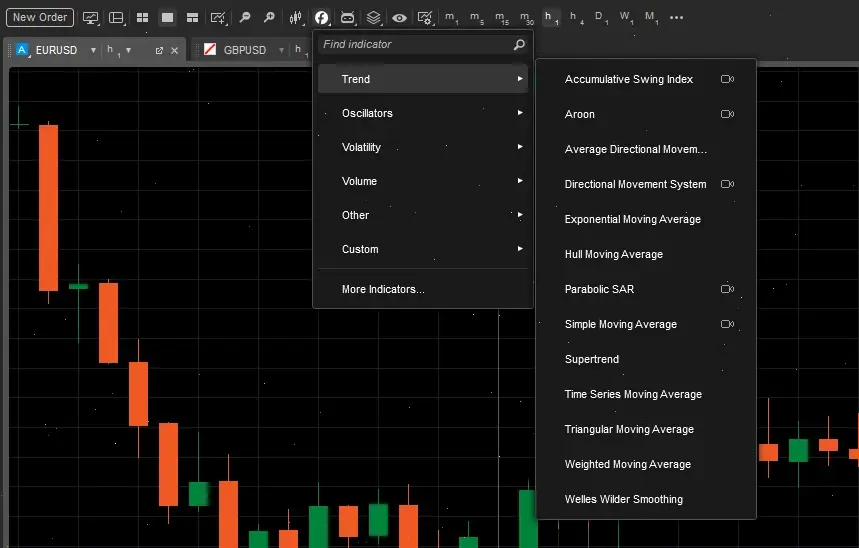
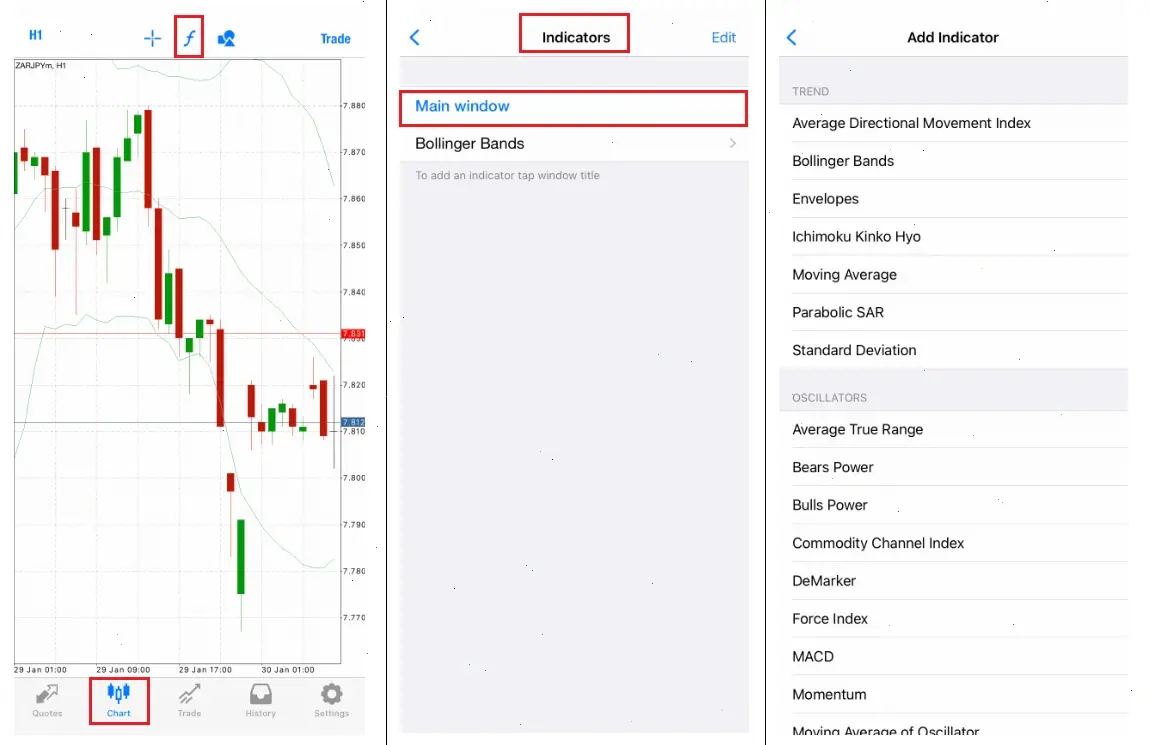
Configure EMA settings by accessing the indicators menu in your trading platform. Select the exponential moving average option and input your preferred periods. We automatically apply different colors to distinguish between multiple EMA lines on your charts.
Moving Average Convergence Divergence (MACD)
MACD combines trend-following and momentum characteristics in a single indicator. Our platform calculates MACD using 12-period and 26-period EMAs with a 9-period signal line. We display MACD as both a line chart and histogram for comprehensive analysis.
The MACD generates signals through line crossovers and divergence patterns. We highlight bullish signals when the MACD line crosses above the signal line. Our system also identifies bearish divergences when price makes higher highs while MACD makes lower highs.
Pinpointing Entries with Momentum Indicators
Momentum indicators help identify overbought and oversold conditions in South African financial markets. We integrate Relative Strength Index (RSI), Stochastic Oscillator, and Williams %R into our trading platforms. These oscillators provide clear signals for potential reversal points and continuation patterns.
Relative Strength Index Implementation
RSI measures the speed and magnitude of price changes on a scale from 0 to 100. Our platform automatically calculates 14-period RSI values and displays overbought levels above 70 and oversold levels below 30. We provide visual alerts when RSI reaches extreme levels.
Stochastic Oscillator Analysis
The Stochastic Oscillator compares closing prices to price ranges over specific periods. Our system uses %K and %D lines with default settings of 14, 3, and 3 for period, %K slowing, and %D moving average respectively. We generate buy signals when both lines cross above 20 and sell signals when crossing below 80.
Gaining an Edge with Volume Analysis
Volume indicators are crucial for confirming price movements and identifying potential trend reversals. Our platform integrates On-Balance Volume (OBV), Volume Weighted Average Price (VWAP), and Accumulation/Distribution Line indicators. We display volume data alongside price charts for comprehensive market analysis.
Volume analysis reveals institutional activity and market sentiment in South African trading sessions. We provide real-time volume calculations and historical comparisons to identify unusual trading activity. Our system highlights volume spikes that often precede significant price movements.
Mastering Volatility with Bollinger Bands
Bollinger Bands consist of a middle moving average with upper and lower bands positioned two standard deviations away. Our platform automatically calculates these bands using 20-period moving averages and adjusts band width based on market volatility. We provide visual signals when prices touch or breach the bands.
Band Squeeze and Expansion Patterns
A band squeeze occurs when volatility decreases and the bands contract around the moving average. Our system identifies these low-volatility periods and alerts traders to potential breakout opportunities. We highlight squeeze conditions when band width reaches historical lows.
Mean Reversion Strategies
Bollinger Bands excel at identifying mean reversion opportunities in ranging markets. We generate buy signals when prices touch the lower band and show signs of reversal. Our system confirms these signals using RSI oversold conditions and positive volume patterns.
Identifying Key Levels with Support and Resistance
Our platform automatically identifies key support and resistance levels using price action analysis and volume profile data. We calculate these levels based on historical price reactions, pivot points, and Fibonacci retracements. The system updates these levels in real-time as new price data becomes available.
Support levels represent areas where buying pressure historically exceeds selling pressure. We mark these levels on charts using horizontal lines and provide alerts when prices approach these zones. Our algorithm considers both psychological levels (round numbers) and technical levels (previous highs and lows).
Projecting Market Moves with Fibonacci Tools
Fibonacci analysis provides mathematical levels for potential support, resistance, and price targets. Our platform includes automatic Fibonacci tools that calculate retracement levels (23.6%, 38.2%, 50%, 61.8%, 78.6%) and extension levels (127.2%, 161.8%, 261.8%). We apply these levels to significant price swings for day trading analysis.
Reading Market Psychology with Candlestick Patterns
Our platform includes automated candlestick pattern recognition for over 30 reversal and continuation patterns. We identify single-candle patterns (Doji, Hammer, Shooting Star) and multi-candle formations (Engulfing, Harami, Morning Star). The system provides real-time alerts when these patterns form on your selected timeframes.
Candlestick patterns reveal market psychology and potential price direction changes. We analyze the relationship between opening, closing, high, and low prices to determine pattern validity. Our algorithm considers pattern context, including trend direction, volume, and previous support/resistance levels.
Your Trading Ecosystem: Platform Integration and Alerts
We integrate all technical indicators seamlessly across MetaTrader 4, MetaTrader 5, and cTrader platforms. Our system synchronizes indicator settings, alert configurations, and custom templates across devices. You can access the same analytical tools whether trading from desktop, mobile, or web platforms.
Success in the fast-paced world of day trading hinges on your ability to interpret market signals accurately. By harnessing the best indicators for day trading analysis provided by FxPro, you can elevate your strategies and make more informed decisions. We continuously update our indicator library and analytical capabilities to support evolving trading strategies.
FAQ
- What platforms support FxPro's technical indicators?
- FxPro's indicators are supported on MetaTrader 4, MetaTrader 5, and cTrader platforms.
- How often are the indicator values updated?
- Indicators update in real-time with millisecond precision to ensure accurate market timing.
- Can I customize indicator settings?
- Yes, you can customize periods, colors, and alert configurations across supported platforms.
- Are volume indicators useful for identifying institutional activity?
- Yes, volume analysis tools like OBV and VWAP help reveal institutional trading patterns and market sentiment.
- Does FxPro provide alerts for candlestick patterns?
- Yes, the platform offers automated recognition and alert notifications for over 30 candlestick patterns.