Forex Price Action
Forex Price Action

Introduction
Price action trading in forex is one of the most effective methods used by traders to analyze and predict market movements. This approach relies purely on the historical price movement of currency pairs, without the use of indicators or other complex tools. The focus is entirely on the raw price data, allowing traders to make decisions based on price patterns, market structure, and momentum.
In this article, we will explore the core concepts of forex price action, how to read price charts effectively, and implement various strategies that can be applied to the FxPro trading platform. This guide will provide a structured overview of the most common price action strategies and how you can use them to improve your trading performance.
What is Forex Price Action?
Forex price action refers to the movement of currency prices over time, displayed on a chart. The price action itself forms patterns that traders interpret to forecast future price movements. Price action traders believe that all market information, including fundamentals, is already reflected in the price, and thus, by studying the price movement, they can make accurate predictions.
Key Components of Forex Price Action
- Candlestick Patterns: These are the basic building blocks of price action. Candlesticks represent the open, high, low, and close prices of a given period. Traders use various candlestick patterns to identify potential reversals or continuations in the market.
- Support and Resistance: These are levels where the price has historically had trouble moving beyond. Support is a price level where the market tends to find buying interest, while resistance is a level where selling interest prevails.
- Market Structure: Market structure refers to the identification of trends, such as uptrends, downtrends, and consolidation. Understanding market structure is crucial for determining whether the market is in a trend or ranging.
- Trend Lines and Channels: Trend lines are drawn on charts to identify the direction of the market, while channels represent a range of price movement that is expected to continue unless the price breaks out.
Why Use Price Action in Forex Trading?
Price action trading is highly regarded because it provides traders with a direct view of market dynamics. By focusing on price alone, traders can avoid the clutter of numerous indicators and make decisions based on pure market behavior. Here are some of the key benefits of using price action in forex trading:
- Simplicity: Price action eliminates the need for multiple indicators, making it a simpler approach that focuses on what matters most—price.
- Flexibility: This strategy can be applied to any time frame, from minutes to weeks, and across all currency pairs.
- Clear Entry and Exit Points: Price action provides clear signals for potential entry and exit points based on real-time price movements.
Popular Price Action Trading Strategies
1. Support and Resistance Reversal Strategy
Support and resistance levels are essential in price action trading. The basic idea is to identify key levels where the market has previously reversed or stalled. When the price approaches a significant support or resistance level, traders look for price action signals that indicate a reversal.
Example:
- Currency Pair: EUR/USD
- Time Frame: 1-hour chart
- Strategy: When the price reaches a strong support level (e.g., 1.0800), look for a bullish engulfing candlestick pattern or pin bar formation to signal a potential reversal to the upside.
Step-by-Step:
- Identify Support or Resistance: Find a significant price level where the market has bounced in the past.
- Wait for Price Action Setup: Look for reversal patterns like pin bars, engulfing candles, or inside bars at these levels.
- Enter the Trade: Once the reversal pattern is confirmed, enter the trade in the direction of the reversal (buy at support or sell at resistance).
- Set Stop-Loss and Take-Profit: Place the stop-loss just beyond the support or resistance level. Set your take-profit at the next significant level of support or resistance.
2. Trend Following with Price Action
Trend-following strategies use price action to identify and trade in the direction of the market trend. A trend is a series of higher highs and higher lows in an uptrend or lower highs and lower lows in a downtrend.
Example:
- Currency Pair: GBP/USD
- Time Frame: 4-hour chart
- Strategy: Enter long trades when the price creates higher highs and higher lows in an uptrend, and short trades when the price creates lower highs and lower lows in a downtrend.
Step-by-Step:
- Identify the Trend: Use higher time frames (4-hour or daily) to identify the dominant trend.
- Wait for a Pullback: After identifying the trend, wait for a retracement or pullback that presents a favorable entry point.
- Enter the Trade: Enter a trade when the price shows signs of resuming the trend, such as a higher low in an uptrend or a lower high in a downtrend.
- Use Trend Lines: Draw trend lines to visually confirm the direction of the trend. Only trade in the direction of the trend.
3. Breakout Trading Strategy
Breakout trading involves entering trades when the price breaks out of a defined range or pattern. A breakout occurs when the price moves beyond a key support or resistance level, signaling a potential for large price movements.
Example:
- Currency Pair: USD/JPY
- Time Frame: 30-minute chart
- Strategy: Identify a range-bound market, and place orders just outside the support and resistance levels. If the price breaks through, enter the market in the direction of the breakout.
Step-by-Step:
- Identify the Range: Look for a consolidation or range where the price is trapped between support and resistance.
- Place Orders: Place buy orders slightly above the resistance level and sell orders slightly below the support level.
- Wait for Breakout: Once the price breaks through one of the levels, enter the trade in the direction of the breakout.
- Set Stop-Loss and Take-Profit: Set stop-loss orders below the breakout level for buy orders and above the breakout level for sell orders. Set take-profit at a reasonable distance based on previous price action.
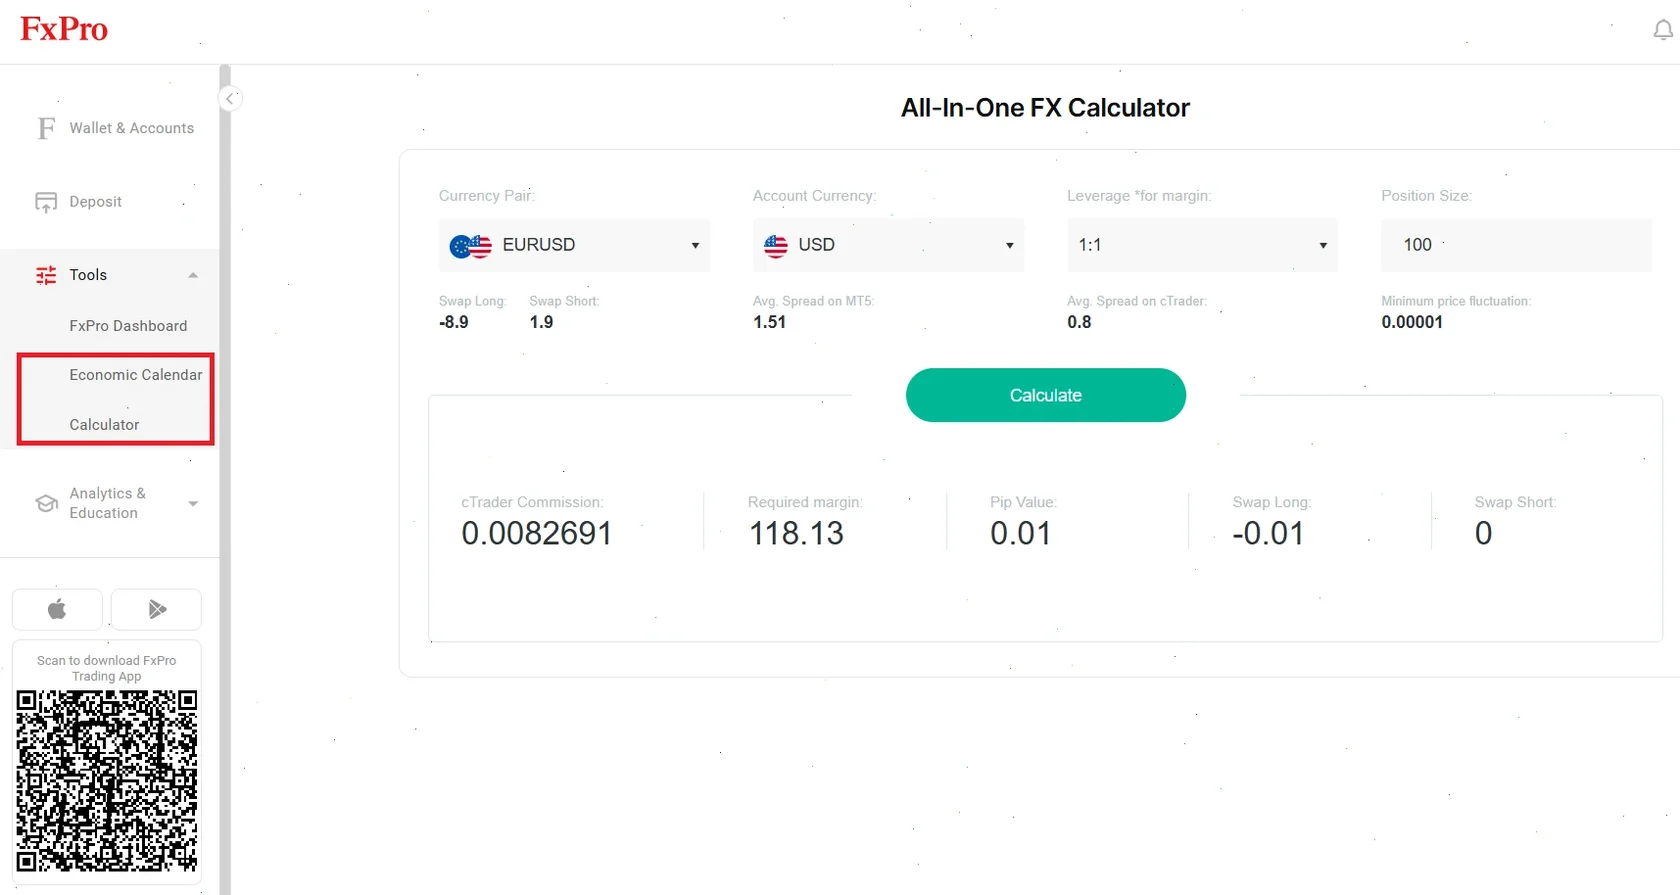
Example: Applying Price Action to the FxPro Platform
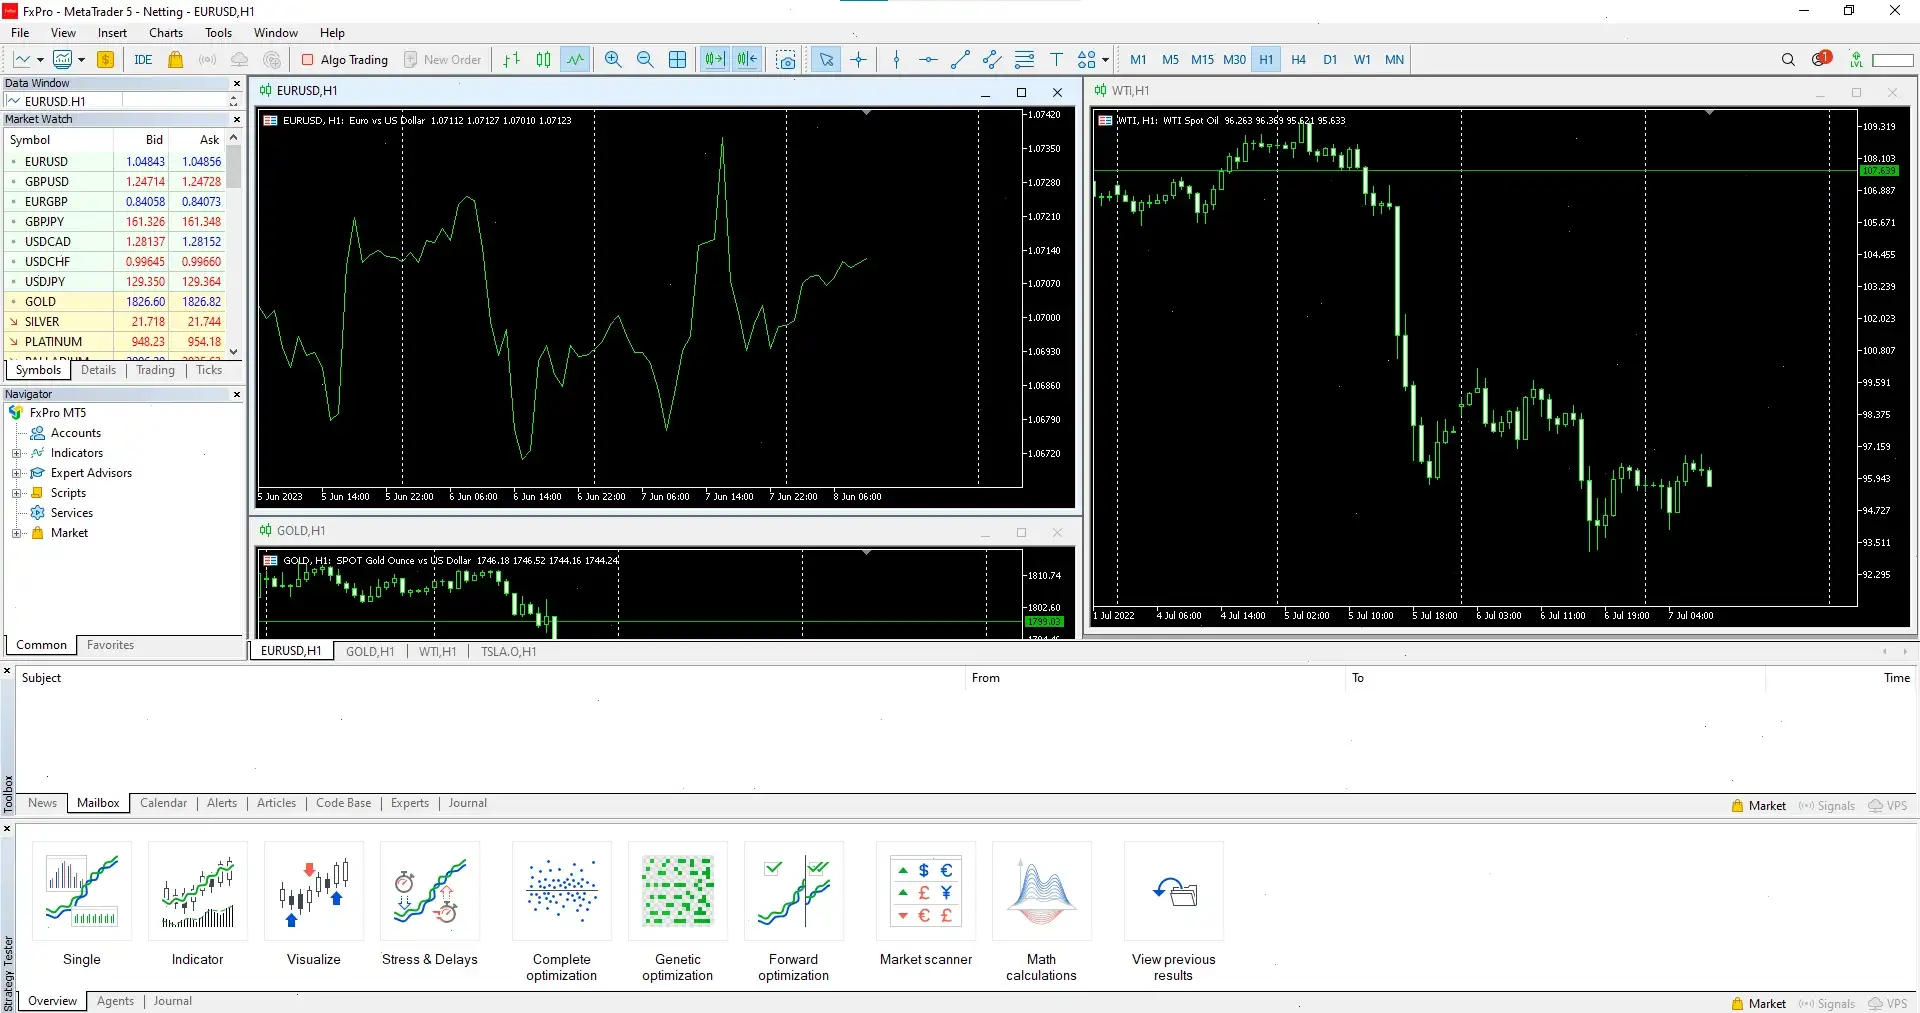
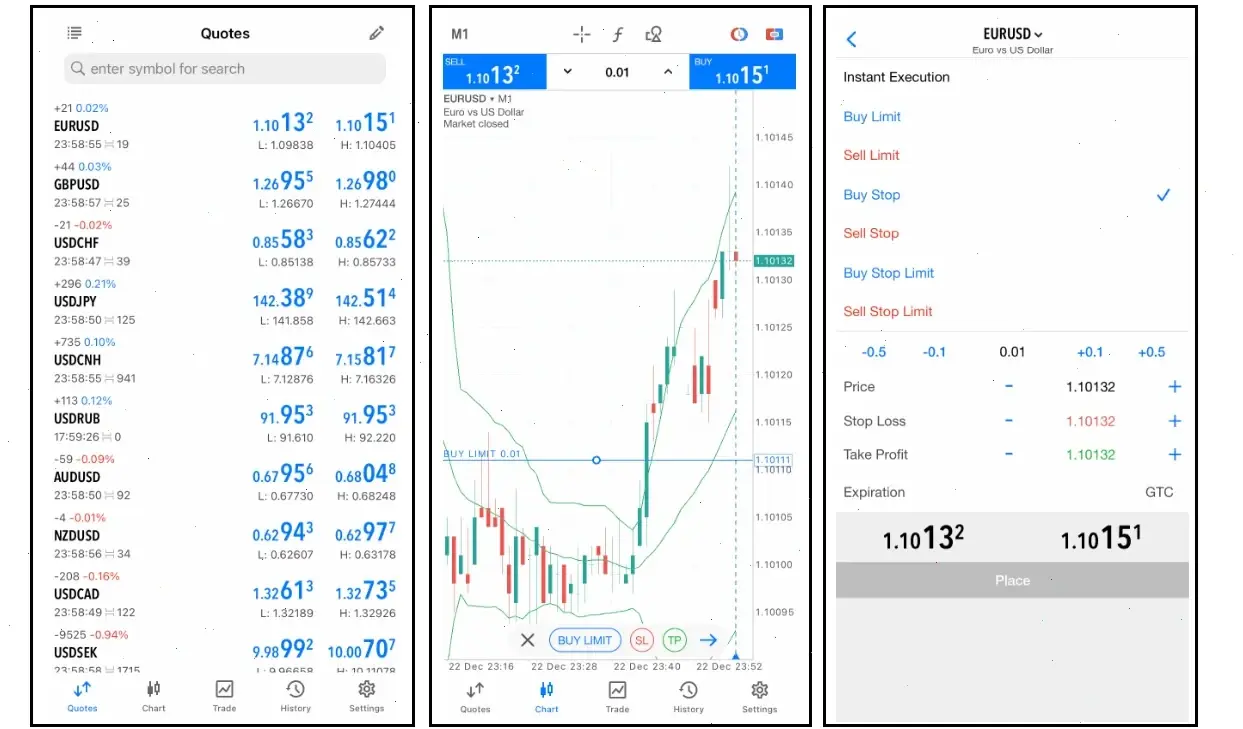
On the FxPro trading platform, you can apply price action techniques to any currency pair, including EUR/USD, GBP/USD, or USD/JPY. The MetaTrader 4 (MT4) or MetaTrader 5 (MT5) platforms offer advanced charting tools, including candlestick charts, trend lines, and support/resistance markers.
For instance, on November 1, 2024, the EUR/USD formed a pin bar near a support level of 1.0875, signaling a potential reversal. Using the price action strategy outlined above, you could have entered a buy position at 1.0880, setting your stop loss at 1.0850 and your take profit at 1.0925. This trade would have been a 50-pip profit as the price reached your target.
Conclusion
Price action trading is one of the most effective methods for analyzing the forex market. By understanding and utilizing various price action strategies, such as support and resistance reversal, trend following, and breakouts, traders can enhance their decision-making process and improve their overall performance.
The FxPro platform provides all the necessary tools to apply price action techniques in real-time, from simple candlestick charts to advanced trend lines and drawing tools. Whether you’re a beginner or experienced trader, mastering price action can help you make more informed and confident trading decisions.
FAQ
- What is Forex price action trading?
- Forex price action trading is a method that relies solely on the price movement of currency pairs. Traders analyze historical price data to predict future movements without the use of indicators.
- How do I use price action effectively?
- Price action is used by identifying key price levels like support and resistance, recognizing price patterns like pin bars or engulfing candles, and following trends or breakouts.
- Is price action better than using indicators?
- Price action trading eliminates the need for indicators and focuses purely on price data. While indicators can provide helpful insights, price action gives a direct view of the market's behavior.
- How do I identify trends with price action?
- Trends are identified by looking for patterns of higher highs and higher lows in an uptrend, or lower highs and lower lows in a downtrend. Trend-following strategies can then be applied to trade in the direction of the trend.
- Can I use price action on all time frames?
- Yes, price action can be applied on any time frame. Traders can use it on short-term charts for quick trades or on longer time frames for more stable trends and larger market moves.